
Suspicions confirmed!
I found the error I made in the correlation calculations: bad random numbers. This is always a stumbling point in using random distributions to check actual data. My mistake was subtle enough to be forgivable; had I grossly erred, then the standard deviations I computed for the random distributions would have been zero. They weren’t zero; instead, they were very small. I won’t bother explaining the mistake I made – it’s a rather lengthy explanation. Suffice it to say that, once I had figured out the mistake and ran the correlations properly, I came up with more reasonable standard deviation values. Here’s the new graph:
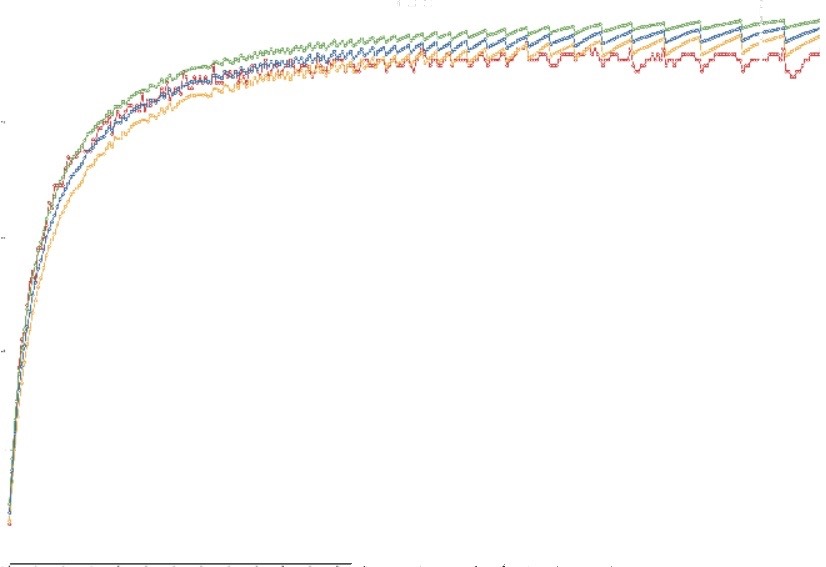
Figure 1: correlation coefficients versus bin size
I had to go to extreme measures to make the various curves separately visible. The red curve shows the results from the actual data; the blue curve shows the means for the random data; the green curve marks one standard deviation above the blue curve; and the yellow curve marks one standard deviation below the blue curve. You should be able to make out that the actual data (red) stays within one standard deviation of the random results (blue) for most of the distribution. Thus, we can safely conclude that there was no statistically significant correlation between the observations of the different cameras at any bin size. This stands against the hypothesis of nonrandom distribution. But it’s not the only test.