
Light Curves, corrected
Two days ago I presented my first-level analysis of the Leonid light curves. Then yesterday I discovered a nasty mistake in my results. Today I present the corrected results; much to my relief, they aren’t much different from the earlier results. I’ll begin with the 3D graph showing all the results in a single graph:
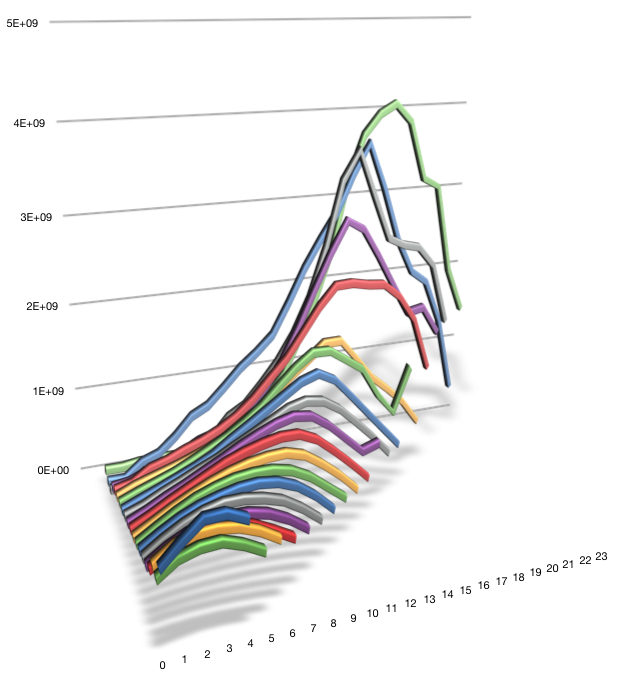
Figure 1: Composite light curves of all Leonids
As you can see, it has the same general shape as the previous one, although the peaks are a little sharper. Here are the corrected versions of the other graphs:
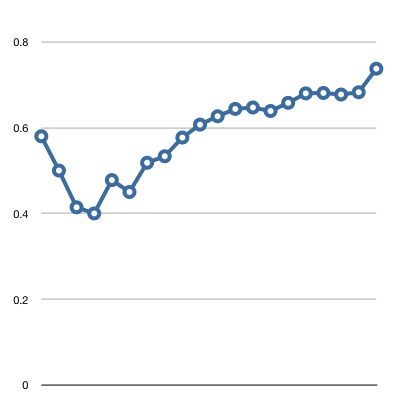
Figure 2: f-value versus length of Leonid
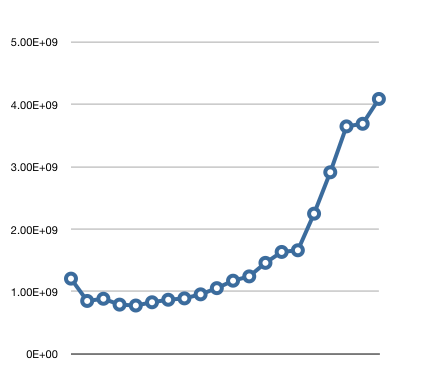
Figure 3: Peak absolute luminance versus Leonid length
You will note that this graph does NOT show the down turn at the right edge that characterized the previous version of the graph. In other words, that down turn was an artifact of the mistake I had made. We can all breathe easier!