
Light Curves, Part II
Let’s talk about the physics of what happens when a meteor rips through the atmosphere. All Leonids enter the atmosphere with the same velocity: 70.2 km/sec. That means that the only differences in total energy of Leonids is in their mass. If we assume that all of the energy of a Leonid goes into its light output (which is a fairly safe assumption; light emissions are easily the primary form of energy output), then we can say that the differences in absolute luminance are due exclusively to differences in initial mass. Here’s a graph of total energy output versus Leonid length:
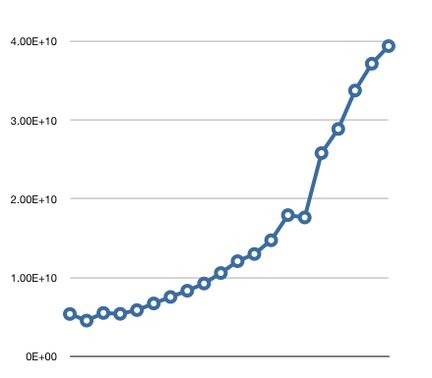
Figure 1: total absolute luminance versus Leonid length
Our basic model for the way meteors burn up in the atmosphere runs something like this: a meteor is a sphere composed of a bunch of teensy-weensy particles. Friction with air molecules dislodges some of those particles, which break loose and are instantly vaporized. The main mass of the meteor does not itself vaporize while all this is happening; instead, its leading surface is eroding away in a process called ablation. If the atmosphere were of uniform density, then this model would predict that the meteor would be brightest at the outset, because the amount of ablation and consequent vaporization would depend on the surface area of the meteor, which would steadily diminish as the meteor is ablated away. This is not what we see, however, because the atmosphere is not uniformly dense; the deeper the meteor penetrates into the atmosphere, the greater the density of air it encounters, which in turn increases the rate of vaporization and ablation. Here’s a graph of the density of the upper atmosphere:
Figure 1: height of measurement versus log of density of air
Source: Tolmacheva, A. V., and V. V. Belikovich (2004), Measurements of the temperature and density of the upper atmosphere using artificial periodic irregularities during the summer seasons of 1999--2002, Int. J. Geomagn. Aeron., 5, GI1008, doi:10.1029/2004GI000061.
This covers most of the range of the Leonids, which first appear at about 114 km height and penetrate as deep as 80 km. I’ll approximate this graph with the following linear function:
log(density) = -0.08 * height + 1.7
The radiant was at an angular altitude of 48º at the peak of the outburst, so we can get an adequate approximation of the height of the Leonids using simple geometry:
height = 114 km - sin(48º) * linear velocity * flare depth in seconds
= 114 km - 0.75 * 70.6 km/sec / 1/30 second/frame
= 114 km - 1.75 km/frame * frames
Combining the two equations gives us
density = 10**[ -0.08 * (114 km - 1.75 km/frame * frames) +1.7]
There are two factors at work:
1. The amount of ablation (and therefore light) is proportional to the density of the air that the meteor encounters.
2. The amount of ablation is proportional to the frontal area of the meteoroid.
Ablation is measured in cubic meters per second -- how much material is stripped off and vaporized every second. So the first factor above is expressed mathematically by:
Ablation rate = k * air density * radius**2
where k is a proportionality constant and radius applies to the meteoroid sphere. But the radius of the sphere decreases as material is ablated away, so we have to do some calculus. Ugh -- it has been 35 years since I did any calculus. Let us gird our loins and pray. The radius of the meteoroid at any point in its trajectory is dependent upon its initial radius minus the amount of material that has already ablated away. The idea is easier to express in terms of its total volume:
Volume of meteoroid = initial volume - integral(ablation rate) over time
or, to express it in more succinct mathematical form:
4/3 * pi * r(t)**3 = 4/3 *pi * r(initial) - ∫ k * air density * r(t)**2 dt
At this point, I must confess that I am unable to handle an integration of this complexity, because it has the r(t) function on both sides of the equation, which is way beyond my rust-encrusted skills. So I’ll have to handle the problem numerically -- fortunately, this is quite easily managed with a spreadsheet. So I slapped together some stuff on my spreadsheet and got this result:
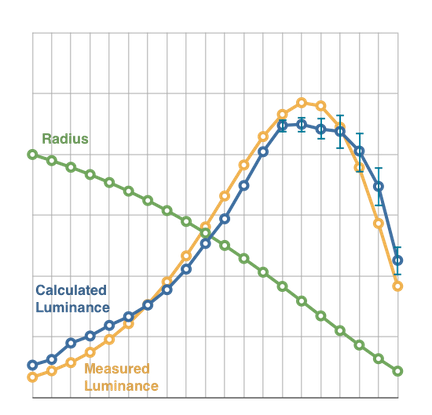
Figure 2: Model prediction (blue) versus data (yellow) with radius (green)
My simple model (yellow) has about the same area underneath it as the blue data; I adjusted the coefficients to get the best fit, and as you can see, that fit is pretty good. Apparently my model is a decent approximation of reality. So I dug around on the Internet looking for ablation models and was horrified by what I found. Basically, it’s way too complex for me to understand. For example, here’s a little something I found in one paper:
Sorry, but this is just too much for my tired old head to cope with. In the same paper, I found this light curve for a Leonid:
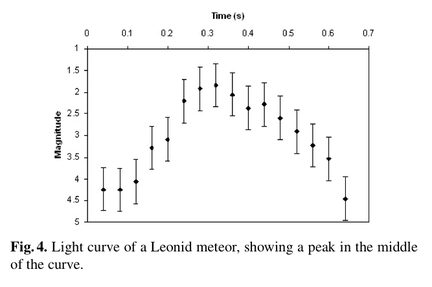
The source for this is M.D. Campbell-Brown and D. Koschny, “Model of the Ablation of Faint Meteors”, Astronomy and Astrophysics, 418, 751-758 (2004). Look at those huge error bars on their data! Compare it with my own error bars. Remember, my graphs show mean values for thousands of meteors. It is striking, however, that the error bars grow large at the end of the Leonid’s path. This suggests that Leonids end their lives in differing ways. I suspect that the difference lies in the final collapse of the Leonid’s structure. During the early parts of the trajectory, the Leonid obeys the simple ablation model, shedding mass cleanly, but as the Leonid grows small, it reaches a point where the pressure of the atmosphere causes the entire meteoroid to suddenly shatter. This would normally produce a sudden burst of light -- what we call a bolide -- but apparently the timing of this burst is variable, depending upon the mechanical strength of the Leonid.