
Today’s problem concerns the history display, which I began working on yesterday. It will take the form of a bar graph, with one bar for each turn, the height of the bar indicating the value of the factor on that turn. It will fit into the existing space reserved for the big image: 650h x 460v. If the game is 30 turns long, and each bar is 20 pixels wide, then it will look something like this:
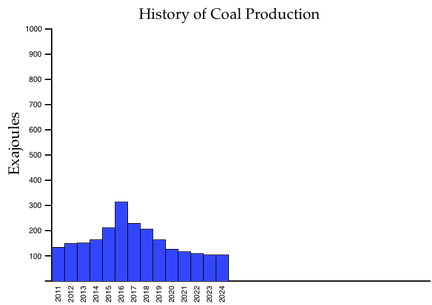
The first question in my mind is, do I use auto-ranging or absolute ranging? Absolute ranging means that I have an absolute maximum value (in this case, 1000 exajoules), that is always used for the vertical scale. Auto-ranging means that I search through the actual data to find the highest value (in this case, about 320 exajoules), and then use that for the vertical scale. The advantage of auto-ranging is that it fills the available screen area, and avoids the silly situation when the bars are all tiny. That situation cannot be avoided when dealing with a factor that could take high values, but starts off small. The disadvantage of auto-ranging is that the scale is visually meaningless. The vertical scale grows or shrinks each turn; this might be confusing to the user. Worse, when we view factors with the same units, we can get very misleading results:
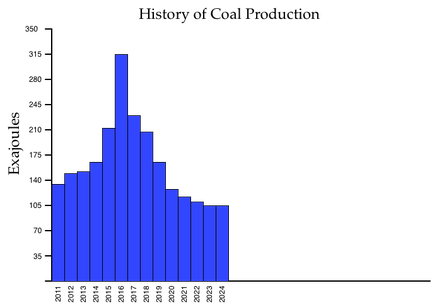
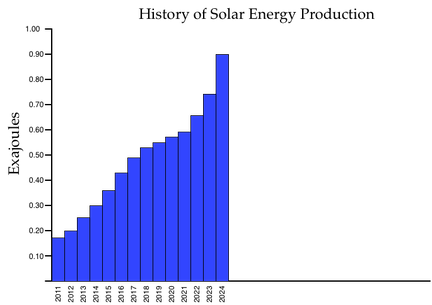
It sure looks like solar energy has completely outstripped coal production, doesn’t it? If you examine the scales, you’ll see that, even at the end, when solar energy is highest and coal production is lowest, coal still outdoes solar by a factor of more than 100! The visual comparison is greatly misleading. Yet if I graphed the solar energy on the same scale as that of coal production, then I’d get something looking like this:
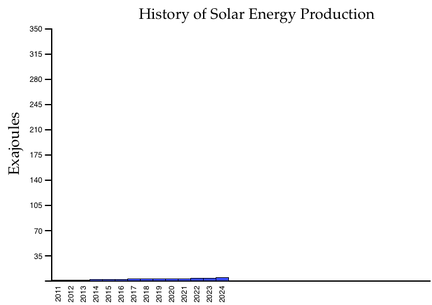
That’s not very useful either, is it? One possible solution is to provide special graphs that show the comparisons. For example, I could have a special case for the Total Energy Production factor, in which each of the sources is shown in a different color, like so:
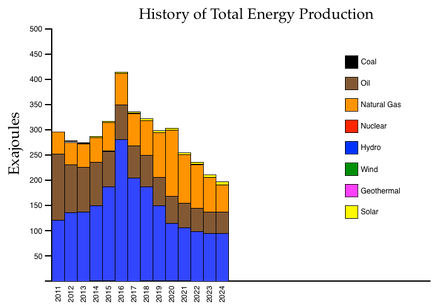
(I was too lazy to make the whole thing; you get the idea.)
I think I’ve reached a decision: auto-ranging for most factors, plus a few special case factors that show comparative values.