
Our first Dokon-Phrontisterion was held on Monday, September 5th, at 8:00 AM PDT. I had intended to develop a set of categories by which we could organize the story worlds that exist, but the results were too complex for that. We started off compiling a whiteboard set of various interactive storytelling technologies; then we organized it vertically by degree of generality, like so:
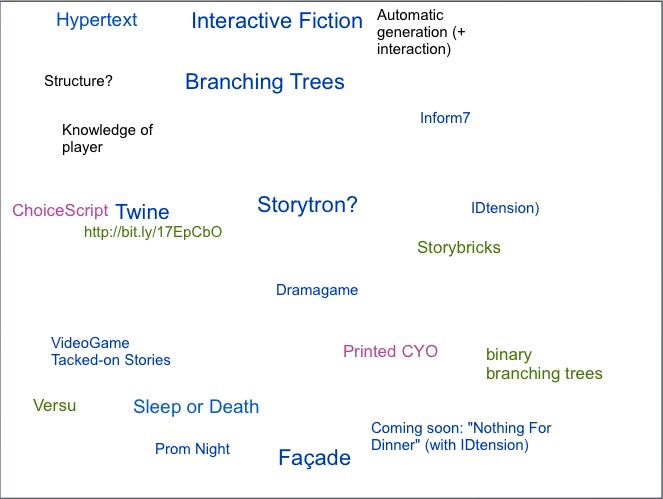
Here, the higher an item is, the more abstract or general it is, while the lower it is, the more specific it is. As you can see, we just slapped together a bunch of things, from development systems to actual products. Then we organized it laterally by degree of interactivity:
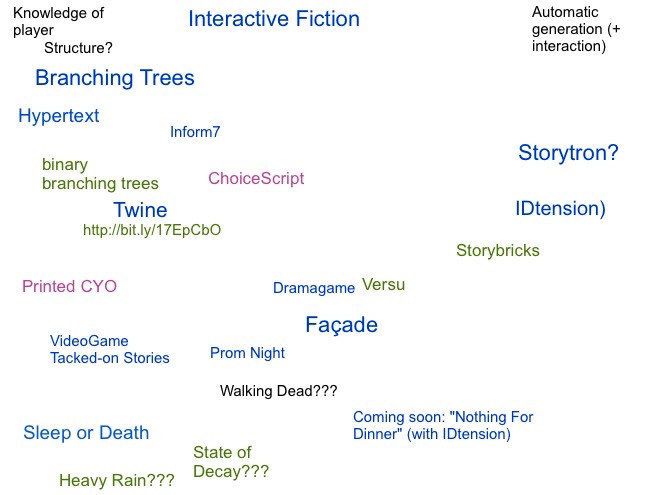
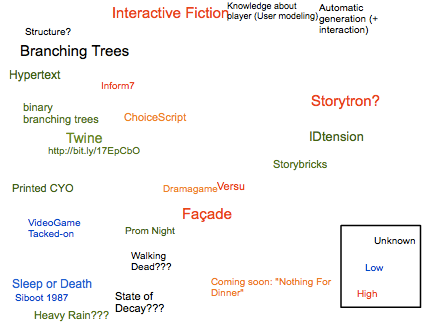
Here, the less interactive items are to the left while the more interactive items are to the right. We're gauging potential for interactivity rather than actual practice. It took us nearly an hour to get this far; there was a lot of uncertainty about these placements. Lastly, we applied color to indicate the degree of narrative potential of each item, with red indicating high potential, green indicating moderate potential, blue indicating low potential, and black indicating "don't know". (This system does NOT apply to the above diagrams, for which color has no meaning.)
From this discussion emerged the idea that I carry out a multi-dimensional scaling analysis of interactive storytelling technologies in order to see if there are any natural categories lurking among them. I abandoned the idea when I realized that we don’t have enough people who know lots of different storyworlds, so we can’t get enough data.