
What in the hell am I supposed to do with this:
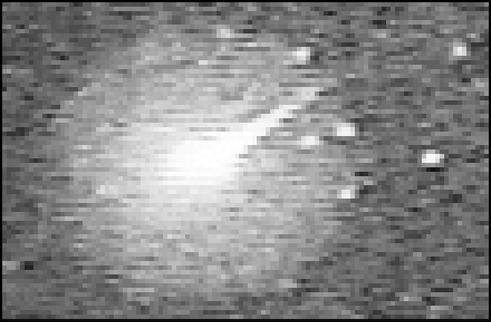
This is a blowup of a Leonid exploding in flash of light. Most Leonids look more like this (same scale)
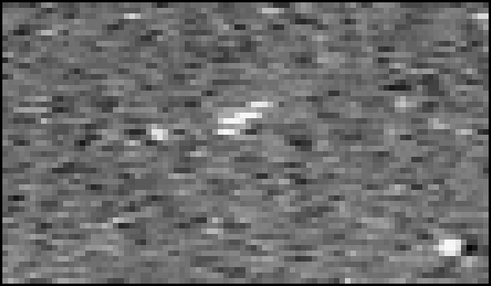
The lower image is easy to recognize as a Leonid, and it’s easy for the software to figure out exactly where the Leonid is. But the upper image drives my algorithms crazy. That halo of light around the Leonid, representing internal reflections in the optics, ends up being treated as part of the Leonid, and so the algorithms have great difficulty figuring an accurate centroid (the position of the exact center of the image of the Leonid). They get a result, but it can easily be way off, depending upon exactly how the light bounced around in the lenses. This in turn makes it impossible for me to match up the parts of the Leonid, because they’re jumping all over the place.
< Light goes on > Aha! I think I know how to handle this: use the size of the flare to track the Leonid once the flare exceeds a certain size. In other words, once a flare gets too big, we stop trying to track it by its position and instead track it by its size. We may not be able to accurately tell precisely where that whale of a flare is centered, but we can be absolutely certain that it goes with the whale of a flare appearing in the previous frame.
Should the transition from position-tracking to pixel-count tracking be sudden or gradual? If I want to use pixel-count tracking whenever possible, it should be a gradual transition, but if I just want to avoid problems arising from humongous flares, then it can be a complete switch above a certain size.
A nasty problem arises: when a Leonid reaches a critical brightness, around 30K units, it creates a halo with a diameter of about 32 pixels; the halo is evident in the upper image. This constitutes a humongous flare, roughly 750 pixels in area. Most Leonid flares have 20 or 30 flares; when we get such a huge flare, the algorithms tend to fail by finding two or three flares inside the halo. This really screws up the calculations. So I need some sort of halo-detection system that says, in effect, “If there’s a halo here, I’m not even going to try to accurately locate the center; I’ll just assign this flare to whatever the most likely Leonid is and leave it at that. I’ll also preclude the identification of other flares within the halo radius.”
Now glut your mind with this scatter diagram:
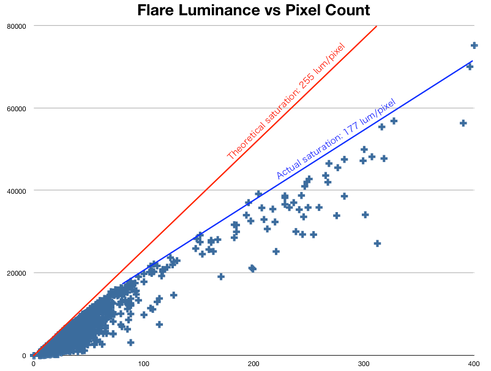
It contains all the flares of all the Leonids in a 30-minute run. Each flare is plotted as a point whose x-coordinate is the number of pixels constituting the flare, and whose y-coordinate represents the net luminance of the flare. The red line shows what the upper limit of the points would be if all the pixels counted in the flare were at maximum luminance of 255 lum/pixel. Note that small flares follow the red line. However, as flares get larger, they shift to a different line (the blue one) with an actual average luminance of only 177 lum/pixel. Why? Two factors contribute to this. The primary factor is a spillover effect inside the image intensifier, in which electrons from an overstimulated pixel spill over to nearby pixels -- but only a short distance. If you have a lot of overstimulated pixels in the image, some electrons, representing luminance, get lost in the shuffle. Hence the lower reading. A second factor arises from internal reflections in the optics -- the halo shown above. However, consider the meaning of this graph:
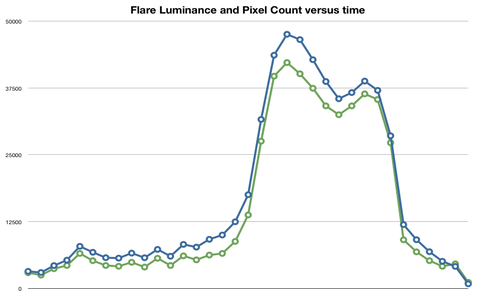
This shows the luminance and pixel count (multiplied by 150) of a big Leonid as they changed over time. The Leonid started off small and stayed small for quite some time; then it suddenly brightened AND expanded in apparent size, before fading away. Here’s a graph of the ratio of the two over time:
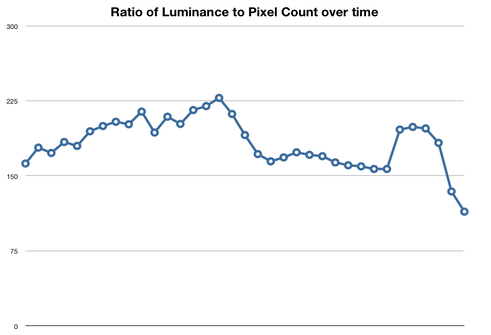
This shows an interesting detail: there was a depression in the ratio of luminance to pixel count right at the peak, during the period when the pixel count was greater than 150 and the luminance was greater than 25,000. This suggests that the deficit represented by the blue line in the first graph above represents a real failure in the instrumentation, and should be corrected for using an equation something like this:
Actual luminance = measured luminance * 255/177
Although this equation should be applied only to Leonid flares with more than 50 pixels -- a very small percentage of the total. Here’s what the previous graph looks like with the correction factor applied:
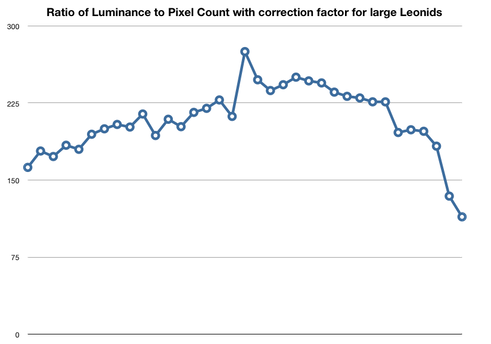
That little spike halfway through is not good -- I’ll need a more detailed correction equation. Otherwise, this graph seems more likely to represent reality than the previous one.
Conclusions:
1. I should probably implement an improved version of the correction equation.
2. I definitely have to give special treatment to large flares with halos, both in terms of incorporating the entire flare into the Leonid, and blocking the creation of inappropriate secondary flares.