
More Temporal-Spatial Randomness
Today’s work is an expansion on yesterday’s. I was unhappy with the fact that my analysis was based on pairs of Leonids that fell within 3.3 seconds of each other (that’s 100 frames, a frame being 1/30th of a second). I therefore decided to look at a larger range of values, running from 10 frames to 200 frames. Here are the results for all six cameras:
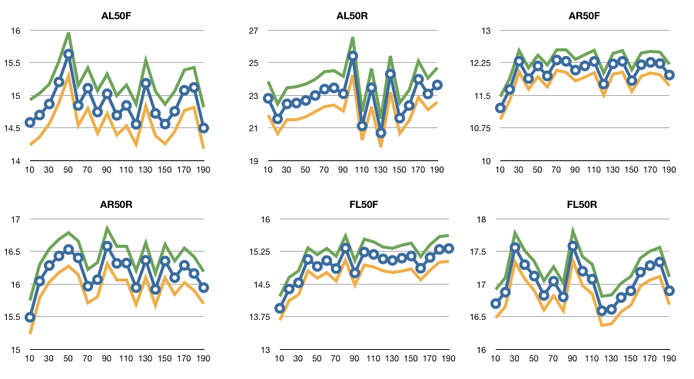
In these graphs, the vertical coordinate is the average separation in degrees between pairs of Leonids; the differences between cameras arise because of differences in the focal lengths of the lenses, the positioning of the camera relative to the image intensifier, and the angular distance in the sky between the radiant and the point the camera was aimed at.
The blue circles represent the average pair distance for pairs of Leonids separated by the number of frames in the horizontal axis. For example, let’s consider the graph for camera AL50F. The first blue circle on the left is at about 14.6º -- that means that Leonids separated by anything from 0 to 9 frames had an average angular separation of 14.6º. The second point shows that Leonids separated by anything from 10 frames to 19 frames had an average angular separation of about 14.7º.
The green and yellow lines mark the “error band” -- they mark the upper and lower bounds represented by one standard deviation above and one standard deviation below the circle. As you can see, the error band is quite narrow relative to the values. This is somewhat troubling. For example, consider the graph for AL50R: there’s wild jiggling between 100 frames and 150 frames of separation. The error bands suggest that this jiggling is not a statistical fluctuation, but is in fact real. But I do not for one minute believe that Leonids separated by 140 frames were radically different from Leonids separated by 150 frames. However, note that the lower bound for 140 frames is higher than the upper bound for 150 frames. This means that the fluctuations are plausibly due to statistical uncertainties. So I’m willing to ignore this matter.
Recall that yesterday I demonstrated that the Leonids were unquestionably nonrandom in that the average angular separations of pairs separated by less than 100 frames were statistically smaller than the average angular separations of all pairs of Leonids. If there really is something to this, then we would expect that the graphs above would all show a general drift upwards. This does not appear to be the case; if you fit a line through the graphs, you get positive slope (good!) on the graphs for cameras AL50R, AR50F, and FL50F. You get negative slope (bad!) on cameras AL50F and FL50R. However, if you look more closely, you’ll notice something interesting: every camera (except AL50R) shows that the first three circles all have a positive slope, and a rather steep positive slope at that. In other words, the nonrandomness is concentrated at separations of less than 30 frames (1 second). I therefore repeated the calculation above, only I looked at the first 30 frames. Because there are fewer Leonids in each bin, the error bars are larger:
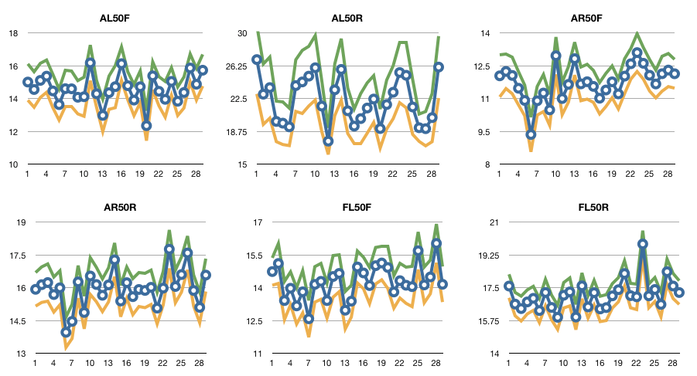
Again, if the nonrandomness is real, then we’d expect to see a positive slope. I’m too lazy to run the least squares fit on this data; instead, as I eyeball it, there’s positive slope for cameras AR50F, AR50R, FL50F, and FL50R, while cameras AL50F and AL50R show zero noticeable slope. But the slopes are too low to justify confidence in any conclusions regarding such close pairs of Leonids. We can, I think, safely conclude that there’s a nonrandomness associated with Leonid pairs less than one second apart, but I don’t think that can make any statement with higher temporal resolution.